
Understanding Nuances of Smallholder Farmer’s Dietary Diversity
The Eastern Gangetic Plains (EGP) region is home to 450 million people of Bangladesh, India and Nepal having the highest global concentration of rural poverty relies on agriculture for food, nutrition and economic livelihoods (Pyne et al., 2023). But the smallholder farmers have been facing major challenge in ensuring a balanced diet, a sustainable and profitable production under current farming system with limited diversity from multiple factors (Brown et al., 2023; Choudhary & Kishore, 2019). Studies have shown that diversifying farm production is significantly and positively associated with improved dietary diversity (Habtemariam et al., 2021; Puspita et al., 2025; Saydullaeva et al., 2022; Sibhatu et al., 2015). Hence, understanding farmers dietary diversity is important in socio-economic and agricultural research for providing evidence and policy recommendation to improve farmers dietary and production diversity which can positively affect sustainable food production system. To do this we often investigate farmers dietary diversity from a quantitative lens with different standardized assessment scales and generalize the findings. Each of these tools provide different unique insights into farmers diet, but the question remains, how effectively these tools capture the nuances of a farming households’ dietary habit and give a holistic picture. Here’s a little summary of the most used tools to assess dietary diversity:
| Tools | What does it capture | Limitation |
|---|---|---|
| Household Dietary Diversity Score (HDDS) | Calculates household food consumption from a standard set of food groups using a 24-hour recall method. It reflects the household’s economic ability to access a variety of foods (FAO, n.d.). |
|
| Women’s Dietary Diversity Score (WDDS) | Assesses diet quality of women of reproductive age (15–49). Uses yes/no questions to determine if at least five of ten defined food groups were consumed in the previous 24 hours. |
|
| Diet Quality Questionnaire (DQQ) | Developed under the Global Diet Quality Project (2016). A country-adapted tool collecting population-level diet data using a 24-hour recall method. Includes indicators such as MDD-W, NCD protection, and Global Dietary Recommendations score. |
|
Can the Dietary Diversity Assessment Tools Capture all the Nuances?
All these tools mentioned above have gained popularity for its efficiency in data collection time and cost factors also have gone through several validation process to standardize the method. The limitations mentioned above on food quantity can be addressed by collecting individual food intake data with tools like ‘Weighed Food Record (WFR)’ and food frequency through ‘Food Frequency Questionnaire (FFQ). But these will be very time consuming and costly and a logistical nightmare for the data collectors. The choice of metrics used to measure food consumption can make substantial differences in both the magnitude and interpretations of outcomes given the sensitivity of the estimates and complexity of interactions among factors like household preference, access to market, production diversity, and seasonal availability (Bandyopadhyay et al., 2021). All these tools individually have unique usability, but none truly captures the nuances of farming households’ dietary patterns, habits, and behaviours which is also important for any set of strategy or intervention design to improve farmers dietary diversity. There is no single tool introduced yet to provide a holistic picture into the dietary patterns of a certain population.
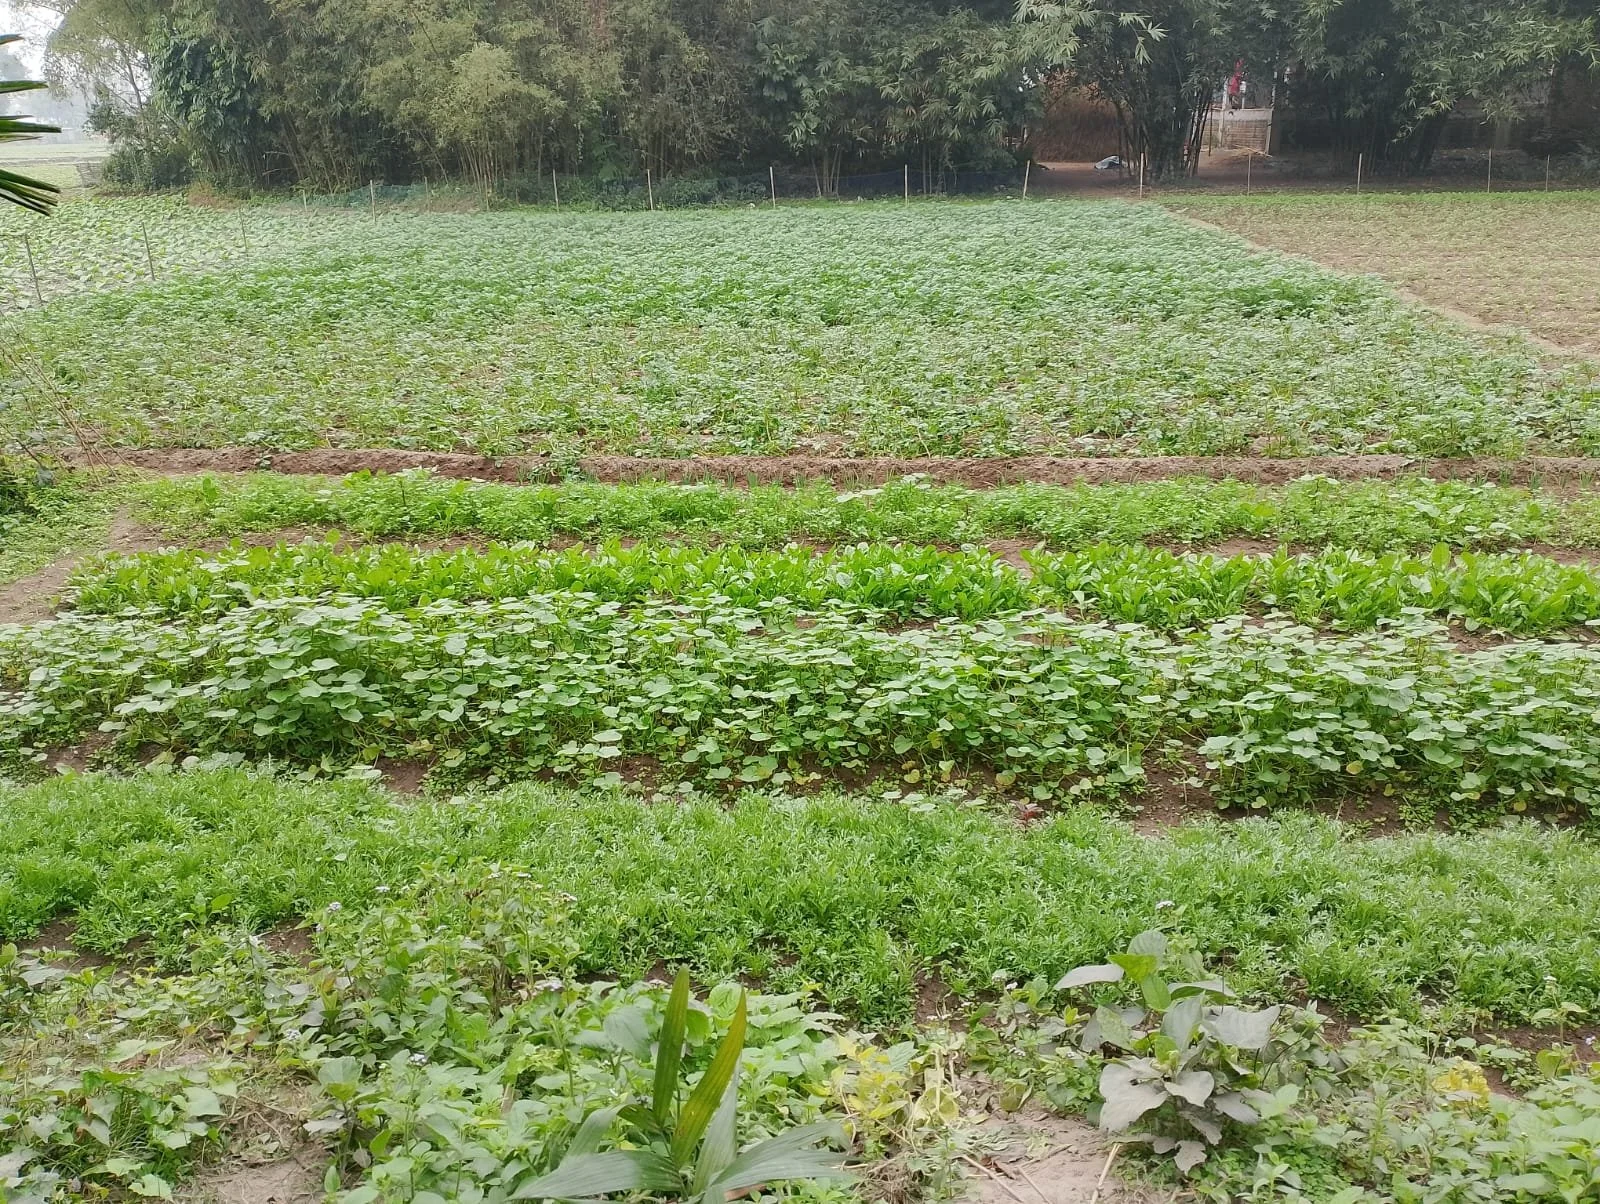
Photo: Diversifying crops for household consumption
RUPANTARs Way of Addressing Nuances
The goal of Rupantar project is to understand the processes and practices that transform the food systems through livelihood diversification to improve farm livelihoods. Reducing inequality, production risk and unsustainable resource use being the core objective Rupantar project tries to understand the trade-offs and synergies of the approaches taken among the farming households. It its 3rd year of implementation Rupantar has employed a mix-method research protocol to understand adoption behaviour of livelihood diversification approaches among smallholder farming communities in Rangpur (Bangladesh), Cooch Behar (India) and Koshi Province (Nepal). As a part of it while trying to understand farmers dietary diversity, the research methodology includes not only the Diet Quality Questionnaire but farmers dietary habits have also been captured through case studies and in-depth interviews.
What Nuances are Observed Through This Process?
Farmers knowledge, and understanding of food, nutrition, cultural norms, beliefs (religious, social, superstitions) and generational practices define their dietary pattern as well as their production diversity and access to market. All these plays’ role in selection of food generally but it can be diverse among different age and sex groups.
Self-grown foods reduce buying:
Farmers cultivating a range of crops, spices, vegetables and managing livestock’s have access to a wide range of foods. One farmer mentioned, “The only consolation is we do not have to buy much of our food, we only buy lentils”. It is common in farming households to grow different vegetables and leafy greens for household consumption. A farmer stated, “The vegetables are mostly produced in and around our house, we don’t have to buy much”. In this scenario, introducing intercropping with existing farming patterns might influence their diet directly and indirectly with extra income without making a huge change in investment or farming practices. Information on the source of food will not come through these assessment tools. And it is important to gather such information to understand farmers’ mobility and accessibility.
Cultural/religious norms:
Farmers who implemented improved native poultry has observed an increase in the intake of chicken meat and eggs in some households, whereas women from irrigation constrained site of the project stated that, “We can consume the chicken eggs, they hatch as well but we women do not eat chicken”. Then again there are families that completely avoid chickens. A women mentioned, “Well, what I heard about chicken is that it is considered as the bird of Rama. So, both eating and rearing is prohibited”. Another said, “We eat all types of fish. Starting from Pangash fish to all types except the haram ones”. Some of these patterns come from a religious belief and some just as a social norm built and nurtured through generations. Now understanding these nuances is important to design strategy to improve dietary diversity. For example, introducing chicken rearing will not work in such households where both eating and rearing are prohibited.
A farmer said, “Leafy greens, vegetables, rice, lentils — these are part of our meals. We especially like rice and love to eat cooked rice. It is a part of our culture. I do not eat meat myself, but two others in the house do”. Fitting this scenario in any of the tools mentioned above will not provide accurate information about the household and the diverse food habits of its individual. Each tool employed individually will provide different results.
Nutritional gap
Similarly, any of the assessment tools will state that a farmer has taken food from a certain group, but how much and whether it was nutritionally adequate or not is not measured by these tools. A scenario of protein intake in a farmer’s household of four looks like this, “He (husband) works near the river loading sand and stones. I go there with his lunch sometimes, and we ask the nearby fisherman to sell us what they've caught, he then sells us for INR 100 for 250 grams. Last night I cooked fish and daal, today I will make the fish with potatoes, and I will make a tomato pickle”. 100 grams of fish contain roughly 16-30 grams of protein, which varies by the type and size of fish. 250 grams of fish cooked with other elements is not enough for a family of four even if they consume it in one meal.
How critically we are looking into farmer diet when we plan or strategize for dietary improvements defines how impactful and sustainable a solution is.
Conclusion
Understanding the nuances of smallholder farmers’ dietary patterns requires moving beyond simple indicators and embracing the complexity of real-world food systems. Research that carefully combines dietary diversity measures with insights on cultural and social norms, personal choices of homestead production, household dynamics, gender roles, seasonality, market access, and production choices etc. allows us to see not just what farmers eat, but why they eat the way they do. By using context-sensitive tools and inclusive research approaches, we can generate evidence that truly reflects lived realities. Ultimately, addressing these nuances through thoughtful research is essential for designing nutrition-sensitive agricultural policies and programs that are both effective and equitable—ensuring that smallholder farmers are not only producers of food, but also beneficiaries of healthier, more diverse diets.
Written by:
Anupama Islam Nisho, Assistant Research Associate, CIMMYT
Dr. Bhuvana Narayana Rao, Consultant (Senior Social Researcher), CIMMYT
References:
Bandyopadhyay, A., Haile, B., Azzarri, C., & Somé, J. (2021). Analyzing the Drivers of Household Dietary Diversity: Evidence from Burkina Faso. Food and Nutrition Bulletin, 42(4), 530–550. https://doi.org/10.1177/03795721211029092
Brown, B., Chaudhary, A., Sharma, A., Timsina, P., Karki, E., Rashid, M. M., Das, K. K., Ghosh, A., Rahman, W., & Jackson, T. M. (2023). How diverse are farming systems on the Eastern Gangetic Plains of South Asia? A multi-metric and multi-country assessment. Farming System, 1(2), 100017. https://doi.org/10.1016/J.FARSYS.2023.100017
Choudhary, Vishruta; Kishore, Avinash. 2019. Diets in eastern Gangetic Plains of South Asia: Brief assessment of sources and a comparison with the EAT-Lancet recommendations. ACIAR SDIP Foresight Program: Status Report. New Delhi, India: International Food Policy Research Institute (IFPRI). https://hdl.handle.net/10568/146766
Country-Adapted Diet Quality Questionnaires. (n.d.). Retrieved January 29, 2026, from https://www.dietquality.org/country-adapted-dqqs
Habtemariam, L. T., Gornott, C., Hoffmann, H., & Sieber, S. (2021). Farm Production Diversity and Household Dietary Diversity: Panel Data Evidence From Rural Households in Tanzania. Frontiers in Sustainable Food Systems, 5, 612341. https://doi.org/10.3389/FSUFS.2021.612341/BIBTEX
FAO. (n.d.). Guidelines for measuring household and individual dietary diversity. www.foodsec.org
Minimum dietary diversity for women. (2021). In Minimum dietary diversity for women. FAO. https://doi.org/10.4060/cb3434en
Puspita, Y. B., Setiani, S., Wijayanti, D. E., & Priyanto, Moh. W. (2025). Pathways to Food Security: The Role of Farm Production Diversity in Rural Households in Bangkalan, Madura Island. E3S Web of Conferences, 665, 01005. https://doi.org/10.1051/E3SCONF/202566501005
Pyne, S., Guha, S., Das, S., Ray, M., & Chandra, H. (2023). Food insecurity in the Eastern Indo-Gangetic plain: Taking a closer look. PLOS ONE, 18(1), e0279414. https://doi.org/10.1371/JOURNAL.PONE.0279414
Saydullaeva, F., Pardaev, K., Muratov, S., & Tursunkulov, G. (2022). Empirical analysis of smallholder production effect to dietary diversity. 555–562. https://doi.org/10.22616/ESRD.2022.56.055
Sibhatu, K. T., Krishna, V. v., & Qaim, M. (2015). Production diversity and dietary diversity in smallholder farm households. Proceedings of the National Academy of Sciences of the United States of America, 112(34), 10657–10662. https://doi.org/10.1073/PNAS.1510982112;WGROUP:STRING:PUBLICATION